
How To Find Activation Energy as a Function of Conversion for Double-Step Curing Process From DSC Experiments Using Model-Free Kinetics
Required:
1) NETZSCH Proteus Analysis software version 9.10 (or higher)
2) Kinetics Lite option
Introduction
For kinetic analysis it is necessary to open in NETZSCH Protes Analysis software at least 3 experimental curves measured at different temperature conditions, more measurements are recommended. For DSC the segments with different heating rates or segments with different isothermal conditions are used for kinetic analysis.
This example presents the double-step curing of epoxy resin.
Importing DSC Data from NETZSCH Proteus Analysis
- In NETZSCH Protes Analysis software open at least 3 experimental DSC curves measured at different temperature conditions
- For each experimental curve evaluate the peak area for the temperature (or time) range of interest. Please select the baseline, which is necessary for enthalpy evaluation. The evaluation ranges and the baselines can be different for different DSC curves.
- Select curves with peak area evaluation (click and ctrl+click on each curve or single click on DSC axis):
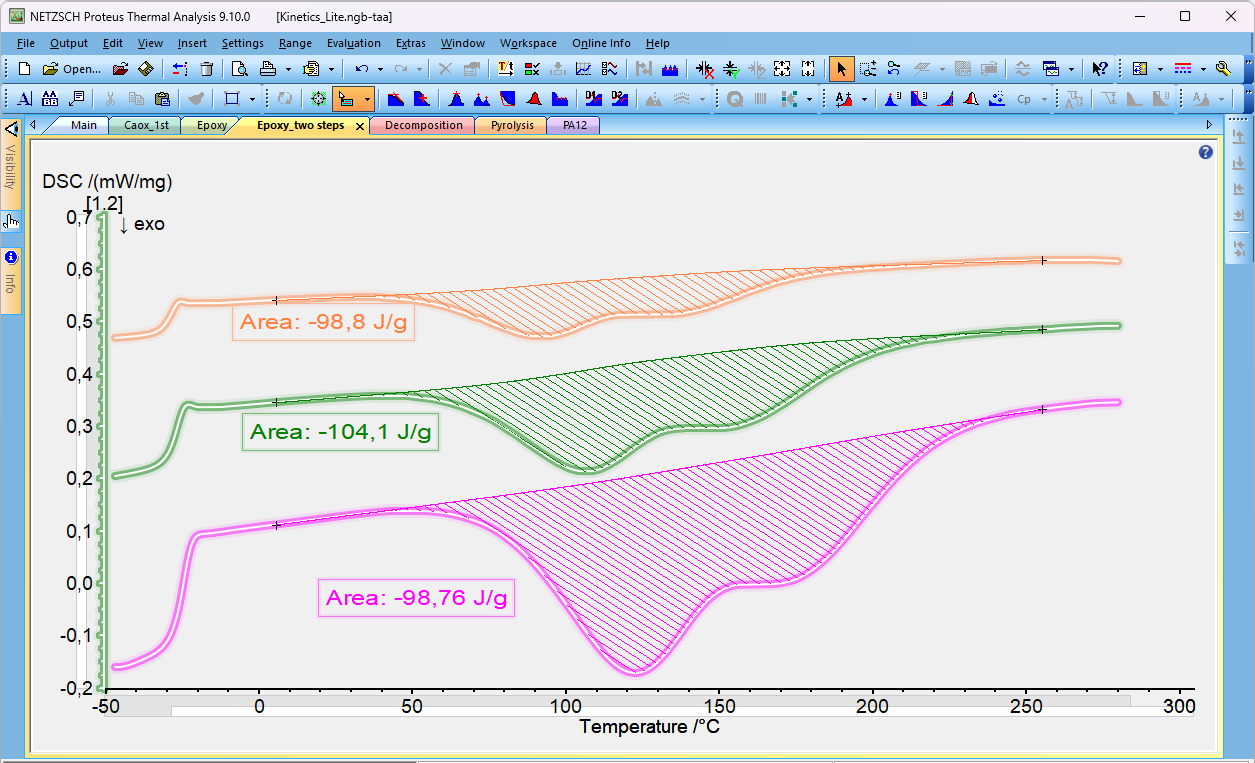
Figure 1. Proteus Analysis software with DSC data for kinetic analysis
4. In NETZSCH Protes Analysis select Kinetics Lite from Extras menu Item.
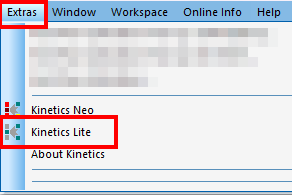
Figure 2. Selection of Kinetic Lite Option in NETZSCH Proteus Analysis software
Result: Kinetics Lite is started, where selected curves are automatically loaded from Proteus Analysis into Kinetics Lite. Only selected ranges are loaded, baselines are subtracted, file names can be seen in Legend if File Name is selected in View ribbon.
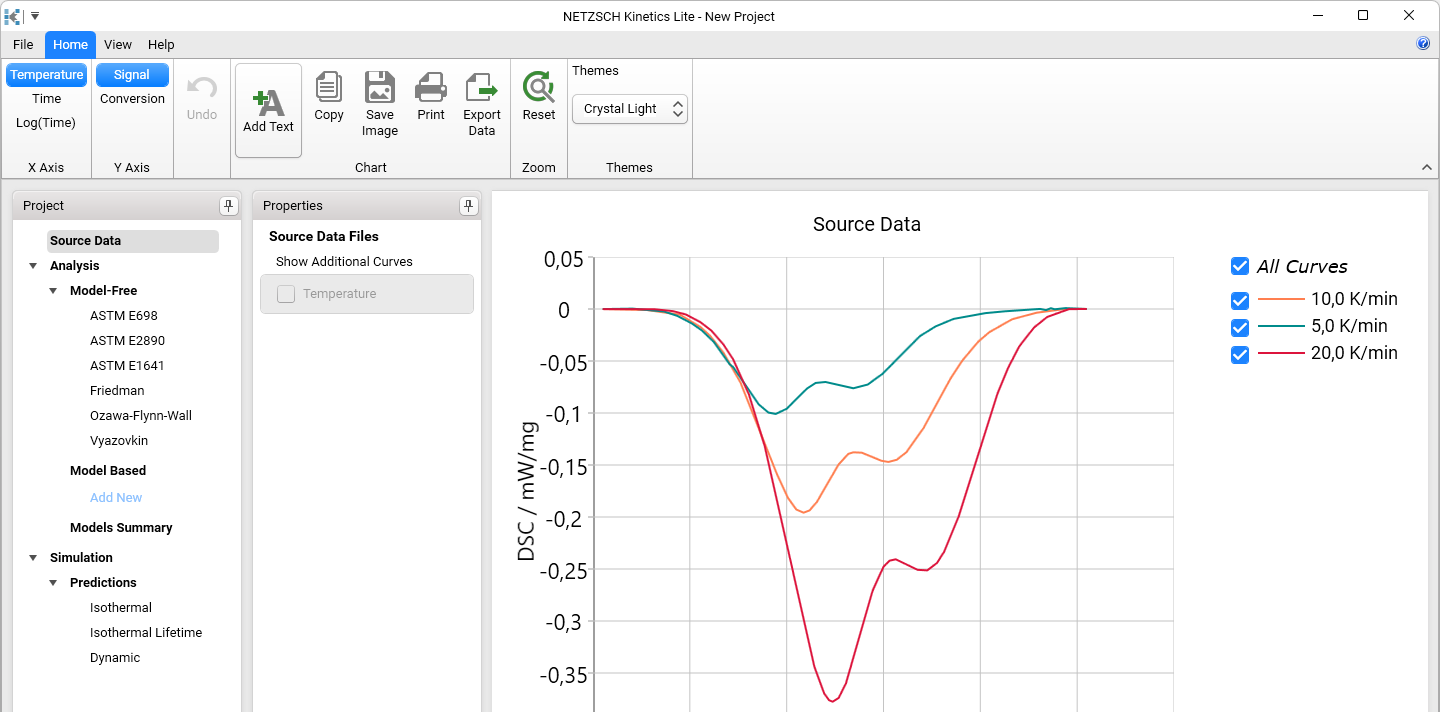
Figure 3. Experimental curves are automatically loaded from Proteus Analysis into Kinetics Lite.
5. In Project Panel click on Friedman to analyze data according to model-free Fredman method.
Result: Model free kinetic method according to Friedman is applied.
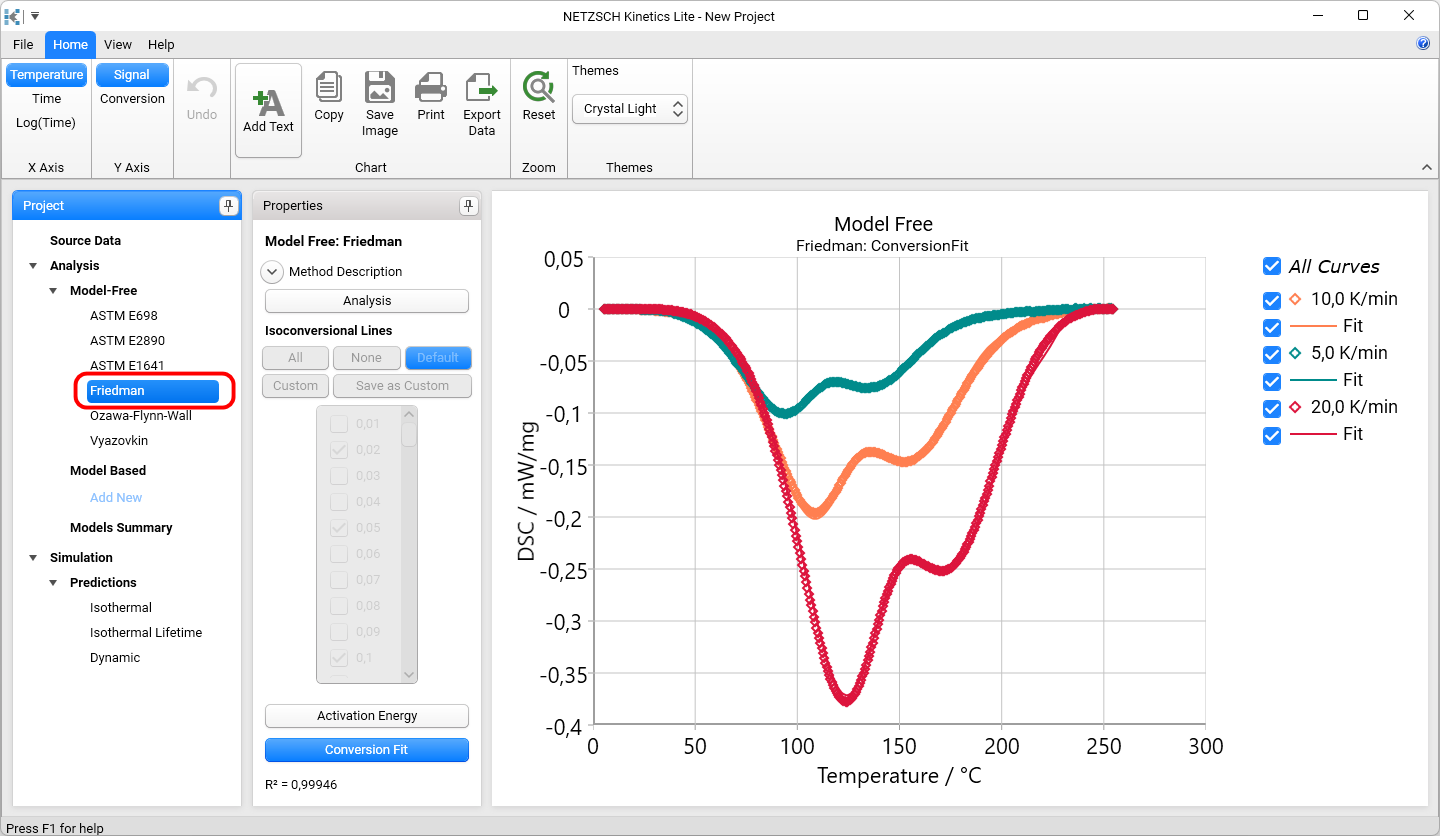
Figure 4. Experimental data (symbols) and simulated curves according to model-free Friedman kinetic method.
In the Properties panel you can find the possibility to show activation energy as a function of conversion. In the bottom of Properties Panel the fit quality R² can be found as well as the possibility to show the error bars for activation energy.
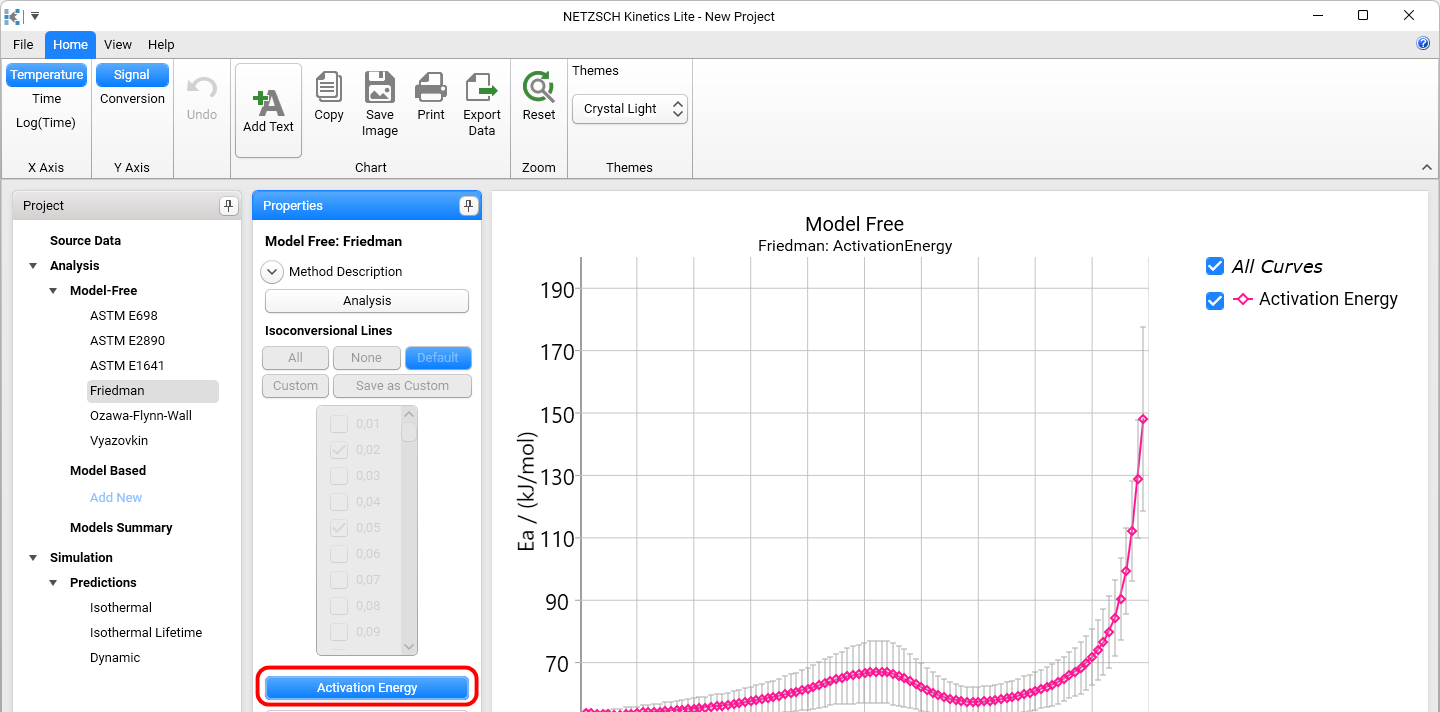
Figure 5. Activation energy as a function of conversion calculated by model-free Friedman method.